



As the founder of a marketing agency for the last 10+ years, I’ve sat through many monthly report meetings before those reports reached clients. In the early days, the first draft almost always arrived as a list of what we did.
Then one day I made it clear what our reports needed to include: a straight answer on whether the digital marketing strategy and efforts we’re putting in are really working in the client’s favour. The problem was never the amount of data. Most agency reports answer the question the agency finds easy: what did we do this month? You need the answer to a different one: what did marketing do for the business?
Every digital marketing company collects plenty of numbers. What separates a useful report from a decorative one is whether those numbers add up to a decision you can make. I’m sure that after reading this quick guide, you will have a clear idea of what questions to ask your marketing team in the monthly report discussion meeting.
Table Of Contents
- What Should A Digital Marketing Agency Reporting Dashboard Actually Do?
- The Numbers A Business Owner Should See First
- Vanity Metrics Are Not Useless. They Are Just Incomplete.
- How A Good Dashboard Connects Marketing Activity To Business Outcomes
- What A Monthly Agency Dashboard Should Help You Ask
- What Should Be Different In A Dashboard For Different Businesses?
- The Dashboard Is Only As Good As The Questions Behind It
- A Simple Test For Any Digital Marketing Agency Dashboard
- A Report Should Make Decisions Easier
What Should A Digital Marketing Agency Reporting Dashboard Actually Do?
A good reporting dashboard explains business performance, not agency activity. It tells you what changed, why it changed, what the change means for the business and what should happen next.
Those are two different jobs.
→ Activity reporting says the agency published six blogs, launched three campaigns and posted twenty times.
→ Performance reporting says organic enquiries rose after two buying-intent pages reached page one, while paid enquiries stayed flat and cost more per lead.
The first tells you the agency was busy. The second helps you decide where the next rupee goes.

A useful digital marketing dashboard answers five questions in order:
- What changed compared with the previous period?
- Why did it change?
- Which channel contributed?
- What did that contribution mean commercially?
- What should we do next?
Most reports stop after the first question. A marketing reporting dashboard that stops there is a scoreboard. It shows the score and leaves you to work out how the game went. I read every dashboard the same way. I check the last question first, because that’s where weak reporting gives itself away.
The Numbers A Business Owner Should See First
Start with business outcomes, then channel performance, then website behaviour. Each layer explains the one above it, so the order matters more than the length of the list. My rule is simple: outcome numbers go on the first page, above anything a single channel produces.
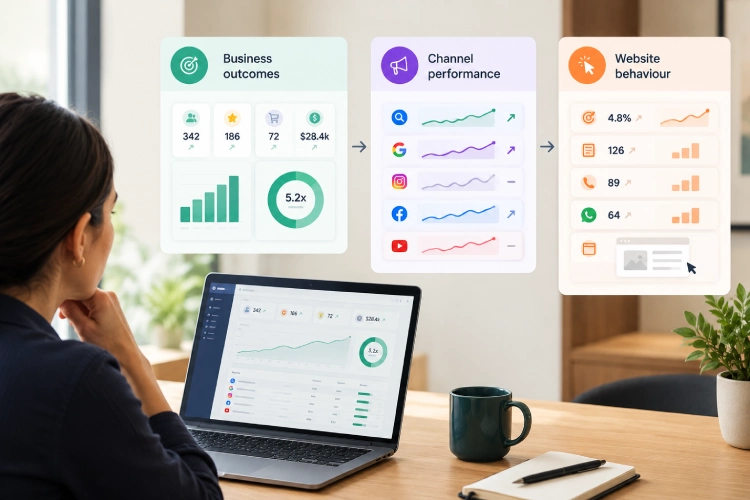
Business outcomes
These answer the question you care about most: is marketing bringing in business?
- Leads and enquiries
- Qualified leads
- Conversions such as bookings, orders or site visits
- Revenue where you can measure it
- Customer acquisition cost (CAC) and cost per lead (CPL)
- Return on ad spend (ROAS) for paid campaigns that sell directly
Raw enquiry counts flatter. A qualified lead count tells you how many enquiries your sales team would actually chase, and I’d take a smaller number of qualified leads over a big pile of raw ones every time. Google Ads guidance points the same way. Its best practice for enhanced conversions for leads is to choose qualified lead or converted lead as the conversion goal, so leads your CRM has vetted feed back into ad reporting.
CPL tells you what an enquiry costs. CAC tells you what a paying customer costs. The gap between them is where budgets quietly disappear. ROAS shows how much revenue each unit of ad spend returns. Google Ads Help explains it with a 500% target, which means five times the revenue for every unit spent.
Channel performance
Show organic search, paid advertising, social, direct or brand demand and any other channel that brings real enquiries, using the same outcome metrics for each. A full-service digital agency often runs several of these at once, which makes it tempting to give each channel its own tidy section. Every section then looks healthy on its own. When I build a report, every channel gets the same outcome columns so you can compare them side by side.
For organic search, Search Console reports how often your pages appeared and got clicked in Google Search, along with average position. That shows visibility. Google Analytics shows what visitors did next. Good SEO reporting connects the two. Paid reporting should tie performance marketing spend to enquiries and revenue, not just clicks.
Website behaviour
Look at conversion rate, landing page performance, form completions, calls, WhatsApp clicks and any other action that signals real interest. Google Analytics 4 calls the actions that matter most to your business key events, and you choose which ones count. The first thing I ask on any account is which actions we’ve agreed to count. If nobody has agreed on that list, every conversion figure in the report rests on a guess.
Not every business needs the same set. A webstore lives on ROAS and conversion rate. A service business cares more about qualified enquiries. Pick the few numbers that match how you make money and ignore the rest until they earn a place.
Vanity Metrics Are Not Useless. They Are Just Incomplete.
Impressions, clicks, traffic and followers are useful diagnostic signals. They only mislead when a report shows them without business context. I still track all four every month. I just never let them stand alone.
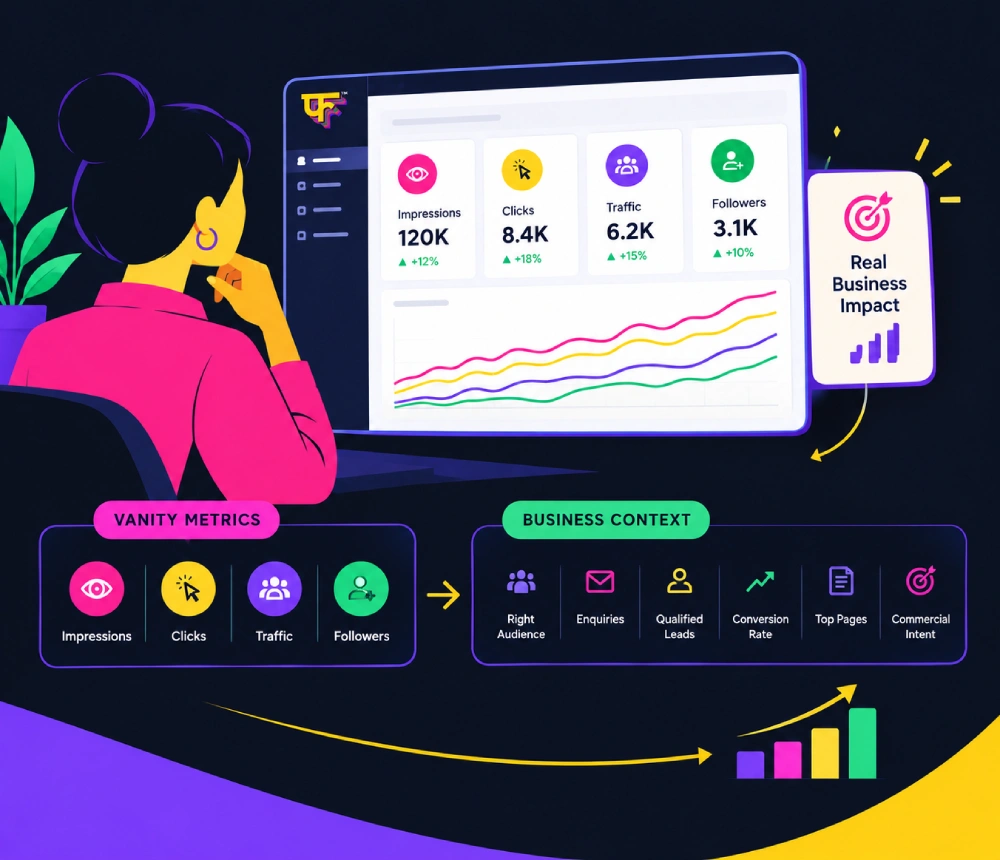
Agency internet marketing reports lean on these numbers because they rise almost every month. Growth is easy to show and hard to argue with. That’s the trap. A rising line can hide a business that hasn’t gained a single extra customer.
Take 10,000 additional visitors. It sounds like a win. Before you agree, you’d want to know:
- Did they come from the right audience?
- Did enquiries increase?
- Did qualified leads increase?
- Did the conversion rate change?
- Which pages attracted them?
- Did those visitors show commercial intent?
Sometimes every answer is good and the traffic is the first sign of a healthy pipeline. Other times traffic doubles because a post on a broad topic ranks well while enquiries stay flat. Neither result is bad in itself. The report simply has to tell you which one happened.
Impressions work the same way. Search Console counts an impression when someone sees a link to your site on Google, which is a long way from someone becoming a customer. It’s a good early signal that a page is gaining ground. It’s weak proof that the page is winning business.
How A Good Dashboard Connects Marketing Activity To Business Outcomes
A good dashboard follows one chain from first touchpoint to commercial result: channel, campaign or content, traffic or interaction, conversion, lead quality and finally the business outcome. Every link should carry a number. When a link is missing, the report should say so instead of leaving a blank. One test I use often is to pick a single enquiry and trace it backwards through that chain. If I can’t, the reporting has a hole.
Two practical examples show how this works.
👉 A jewellery brand publishes category and buying-guide content and organic traffic rises. The useful question isn’t how much it rose. It’s whether visitors reached relevant category and product pages and then called, asked for a callback or visited the store. If they did, the content is working. If traffic rises on pages nobody buys from, it isn’t, however good the line looks. The same gap shows up on social media, where turning Instagram followers into jewellery customers depends on what happens after the follow.
👉 A real estate business has a longer chain. Traffic tells you little. What matters is whether campaigns generate relevant project enquiries, how many become site visits and what happens to the rest. A campaign with fewer enquiries and more site visits can beat one with double the enquiries and none.
Platforms also disagree with each other, and a good dashboard admits it. Meta attributes actions on your website to an ad when they happen within a set number of days, based on the attribution setting at ad set level. Google Analytics uses its own models, and its attribution reports give no credit to direct visits unless the whole path was direct. The same enquiry can therefore appear in two reports with two different sources. Attributed conversion data in Analytics can also keep updating for up to 12 days after a conversion.
None of that makes the numbers useless. I’ve stopped expecting Meta and Analytics to match. In any marketing analytics dashboard I set up, I state which attribution rules sit behind each figure and treat small mismatches between platforms as normal.
What A Monthly Agency Dashboard Should Help You Ask
A monthly dashboard should give you better questions for your next meeting, not just answers to the ones you already had. I’d want you to bring these seven to your next review with your digital marketing agency:
- Which channel produced the most meaningful opportunities, not just the most volume?
- Which campaigns create volume but poor-quality leads?
- Where did conversion rates improve or fall?
- What changed compared with the previous period?
- Which pages or campaigns deserve more investment?
- What should we stop, test or scale?
- Are we measuring the KPIs the business actually cares about?
The last two carry the most weight. I trust an agency that says “stop these two campaigns and move that budget here” because it’s reading the numbers. One that says “performance was steady” is only reporting them.
If your digital marketing company can answer these in the room without promising to get back to you, the reporting is doing its job. If every answer needs another spreadsheet, the dashboard isn’t telling the story it should.
What Should Be Different In A Dashboard For Different Businesses?
There’s no universal dashboard. The right one follows the business model, not the agency’s reporting template. I never start a dashboard from a template. I start from how the business makes money.
- B2B company: qualified leads, pipeline created and cost per qualified lead
- Jewellery brand: enquiries, store visits, product and category demand and high-intent traffic
- E-commerce brand: revenue, ROAS, repeat purchases and conversion rate
- Real estate company: qualified project enquiries, lead-to-site-visit progression and acquisition cost
A good digital marketing agency builds four different dashboards for these four businesses. Think of each as a brand dashboard made for one business, not a template that swaps the logo and colours for every client.
If you sell through showrooms, site visits or phone calls and you work with a digital marketing agency in Ahmedabad, ask how those outcomes reach the dashboard. Web analytics only sees the website. Without a route for offline results, the report keeps crediting the channels that are easiest to track.
The Dashboard Is Only As Good As The Questions Behind It
Tools collect and display data. They don’t decide what matters, and I’ve worked with enough of them to say that plainly. A marketing dashboard tool can pull Google Ads, analytics and other sources onto one screen. Data Studio, the name Google brought back for Looker Studio in April 2026, has a Google Ads connector for exactly that. It solves the collection problem and stops there.
Someone still has to decide what matters, what doesn’t, what changed, why it changed and what action should follow. A dashboard can show that conversion rate on a landing page fell sharply. It can’t tell you the drop began the week the form gained three extra fields. When I see a drop like that, the first thing I check is what changed on the page that week. A digital marketing dashboard without a question behind it is decoration, and data analytics in digital marketing only pays off when it ends in that kind of interpretation.
A Simple Test For Any Digital Marketing Agency Dashboard
Open the dashboard and give yourself five minutes. You should be able to answer five things:
- What did marketing achieve?
- Where did the result come from?
- What changed?
- What does it mean for the business?
- What are we doing next?
I use this test on every dashboard I review, including my own. Treat it as a practical test, not a universal standard. A new account may not have enough history to show what changed. A business with a long sales cycle may need a few months before the commercial meaning is clear. But if you still can’t answer three or four of the five after a few months, the reporting needs to change.
Ask your digital marketing company for that change in plain terms. Put outcomes on the first page. Add a short written summary. End every report with a recommendation for next month. Those are the three edits I ask for first, and they fix most dashboards without adding a single chart.
A Report Should Make Decisions Easier
My view is simple. A good agency doesn’t report to prove that work happened. It reports to make performance understandable and decisions easier. That moves the relationship from reviewing activity to steering the business together, and it’s the clearest sign of a digital marketing company that answers to results instead of deliverables.
At Flora Fountain, a digital marketing agency in Ahmedabad, we build reporting the same way, starting with the decision the business needs to make and working back to the data that supports it. Visibility without conversions isn’t growth, so every dashboard has to show where the two meet.

The founder and partner of Flora Fountain, Shefali leads the Content and Technology divisions. A one-time engineer who started her career writing front-end code, she took a detour sometime during her 9 years in New York, studied journalism and started writing prose, poetry and sometimes jokes. She now has 15...