


A CMO asks a simple question in a board meeting: what did we actually get for the social media budget this quarter? Too many marketing teams answer with impressions, reach and follower growth- numbers that sound impressive and prove almost nothing about business impact. That gap between what gets reported and what actually matters is where most social media budgets quietly lose their case for renewal.
Calculating Social Media ROI properly isn’t complicated once you separate what a platform makes easy to pull from a dashboard from what a business actually needs to know. This piece walks through the real formula, a worked example, how to measure content that never gets a single click, and what counts as a genuinely good benchmark.
In short: Social Media ROI is calculated as [(Revenue from social media minus total social media costs) divided by total costs] x 100, but a complete picture requires tracking both direct revenue and assisted value like earned media, branded search lift and multi-touch attribution, since most social content influences a purchase without being the final click.
Fast facts
| Core formula | [(Social media revenue − social media costs) / social media costs] × 100 |
| What most reports get wrong | Treating impressions, reach and follower count as proof of ROI on their own |
| Real-world proof point | Chili’s Triple Dipper sales rose 70% after organic TikTok virality, reaching 11% of total sales and contributing to 14.1% same-store sales growth in one quarter |
| Paid vs organic timeline | Paid social can show measurable results within weeks; organic brand impact typically takes 6 to 12 months to show in branded search trends |
| Common e-commerce benchmark | A 3:1 ROAS (return on ad spend) is often cited as a baseline for profitable paid social, though this varies heavily by category |
Table of Contents
- What is Social Media ROI, and why is it hard to measure?
- What’s the formula for calculating Social Media ROI?
- Working Example On How to Calculate Social Media ROI
- What metrics should you actually track?
- How do you measure ROI for content that doesn’t get clicked?
- How do you attribute revenue to social media accurately?
- What’s a good Social Media ROI benchmark?
- In Conclusion
- FAQs
What is Social Media ROI, and why is it hard to measure?
Social Media ROI is the measurable value (financial or non-financial) a business gains relative to its social media investments. It is difficult to isolate because social content often acts as top-of-funnel assistance rather than the final conversion trigger.
A CMO asks a simple question in a board meeting: What did we actually get for the social media budget this quarter?
Too many teams answer with impressions, reach, and follower growth—vanity metrics that fail to demonstrate business impact. The primary challenges in measuring true impact include:
- Inconsistent Cross-Platform Data: Platforms define engagement differently, preventing direct comparisons.
- Tracking Degradation: Privacy updates (e.g., iOS changes) impair traditional pixel-based attribution.
- Multi-Channel Overlap: Social operates alongside email, search, and PR, making single-touch attribution inaccurate.
What’s the formula for calculating Social Media ROI?
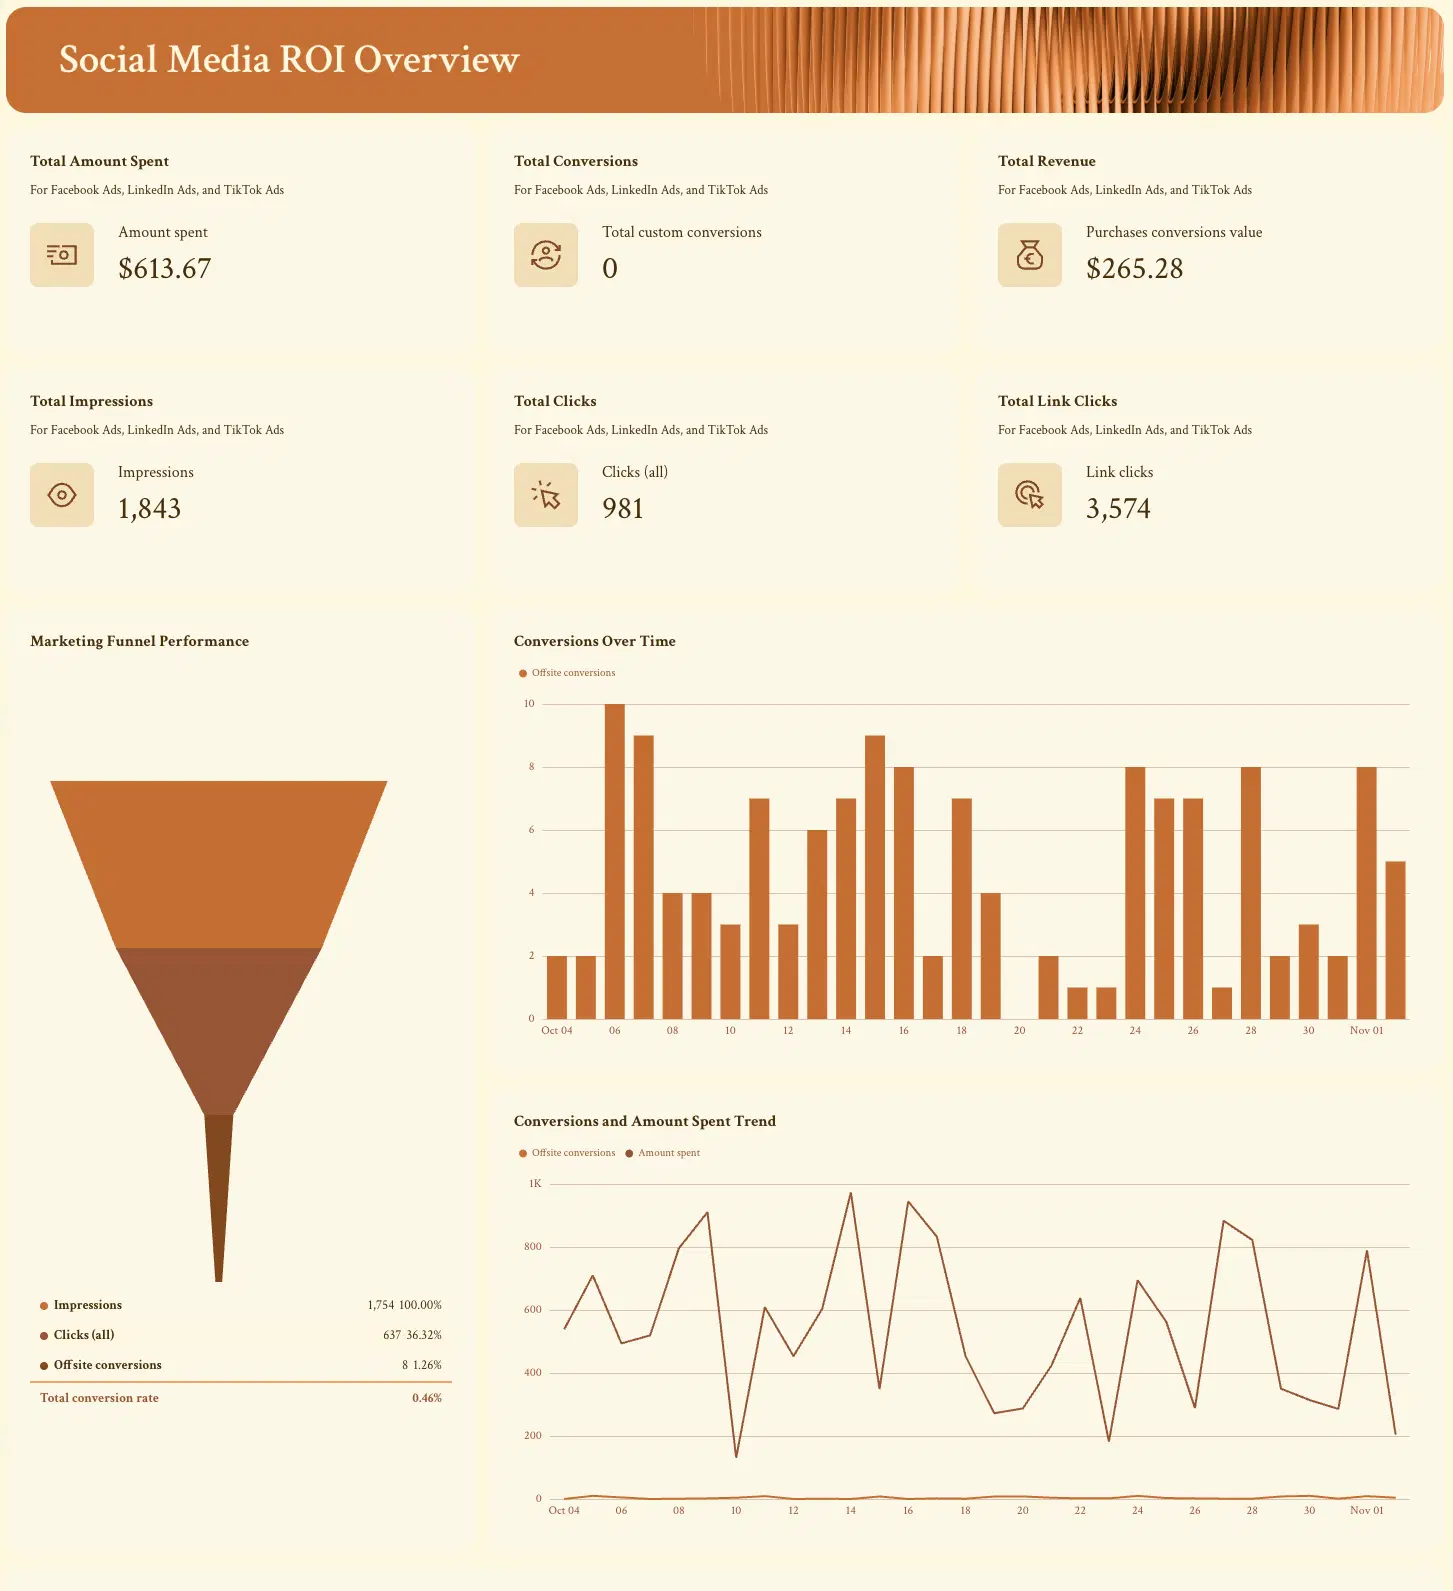
The universal formula to calculate Social Media ROI expressed as a percentage is:
[(Total social media revenue minus total social media costs) divided by total social media costs] x 100, expressed as a percentage that shows how much return you generated relative to what you spent.
To perform an accurate calculation, both revenue and expense variables must encompass all actual inputs:
| Cost Inputs (Total Investment) | Revenue Inputs (Total Value) |
|---|---|
| In-house salaries or agency retainers | Direct UTM-tracked website sales |
| Total ad spend across all platforms | Assisted conversions (multi-touch) |
| Content production (freelancers, tools, shoots) | Micro-conversion value (leads, sign-ups) |
| Analytics and management software fees | Quantified earned media value (EMV) |
Working Example On How to Calculate Social Media ROI
Let’s say a business spends ₹2,50,000 a month on social media across salaries, ad spend and content production, and generates ₹4,00,000 in tracked and assisted revenue from social, the resulting ROI is 60%.
Here’s how that breaks down month by month for a mid-sized Indian D2C or service business:
| Cost item | Monthly spend |
|---|---|
| Social media management (in-house or agency) | ₹1,20,000 |
| Paid social ad spend | ₹80,000 |
| Content creation (photography, video, design) | ₹40,000 |
| Analytics and scheduling tools | ₹10,000 |
| Total cost | ₹2,50,000 |
If tracked direct sales from social came to ₹2,80,000, and a reasonable share of assisted conversions and micro-conversions (newsletter sign-ups that later convert, enquiry form fills) added another ₹1,20,000 in attributed value, total revenue reaches ₹4,00,000.
Social Media ROI = [(₹4,00,000 − ₹2,50,000) / ₹2,50,000] x 100 = 60%
This is a genuinely useful starting figure, but it should never be treated as the whole answer. If this business is a new D2C brand still building brand awareness, some of this month’s spend is buying future demand that won’t show up as revenue until later months, which is exactly why benchmarking against your own historical performance matters more than chasing a single target percentage.
What metrics should you actually track?
Social media metrics fall into two categories: activity metrics, which show whether content is being seen and engaged with, and impact metrics, which show whether that activity is actually contributing to business outcomes, and only the second category belongs in a genuine ROI conversation.
Activity metrics (necessary, but not proof of ROI on their own):
- Impressions, reach and follower growth
- Likes, comments, shares and engagement rate
- Video views and completion rates
Impact metrics (the ones that actually answer the ROI question):
- Website traffic and conversions attributed to social
- Cost per lead or cost per acquisition from paid social
- Earned media value, the estimated cost of the reach and engagement organic content generated, calculated against equivalent paid placement rates
- Branded search volume growth, a reliable proxy for brand awareness built through social over time
- Brand sentiment trends, particularly before and after major campaigns
A useful gut check: 2 million impressions on a post that moves zero purchase intent isn’t a win. 80,000 impressions on a post that measurably lifts branded search volume the following month is. This is the exact distinction a competent Social media marketing agency should be building its reporting around from day one, not retrofitting after a client asks hard questions in a review call.
How do you measure ROI for content that doesn’t get clicked?
Organic short-form video content, Reels, Shorts and TikTok-style formats, rarely drives a click at all, so its ROI is best measured through earned media value, branded search lift and sales attribution at the product level rather than through click-through metrics that were never the point of the content.
This is where a genuinely current example helps more than a formula.
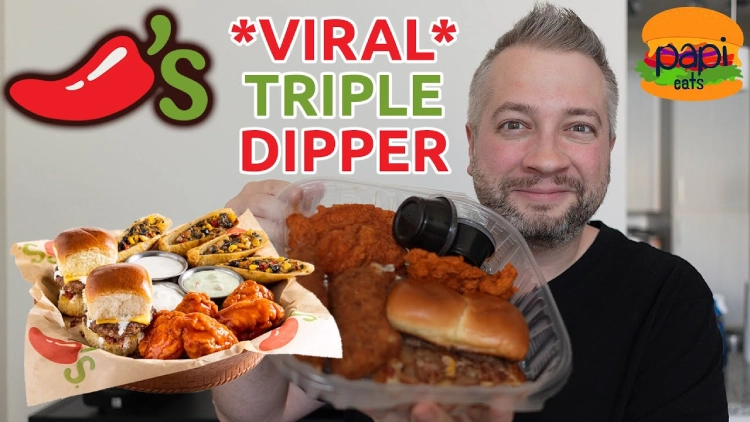
Chilli’s Triple Dipper appetiser went viral organically on TikTok through customer-generated videos, not a paid campaign. The dish’s sales rose 70% over the following year and grew to represent 11% of Chilli’s total business, contributing to 14.1% same-store sales growth and a 6% increase in customer traffic in the quarter that followed. None of that traced back to a single tracked link. It showed up in same-store sales data and product-level sales mix instead.
The takeaway for measuring this kind of content:
- Track product or category-level sales trends alongside content volume and sentiment, not just link clicks
- Watch branded search volume for both the brand name and specific product names, since a viral moment often shows up there before it shows up in direct revenue
- Use watch time and completion rate as quality signals, not vanity metrics, since they indicate whether content is actually resonating rather than just being served
This kind of content builds the same brand equity a well-run Branding Agency aims for through any channel; it just does it through cultural relevance rather than a traditional campaign brief.
How do you attribute revenue to social media accurately?
Accurate attribution requires combining several methods rather than relying on one: UTM-tagged direct tracking for e-commerce, multi-touch attribution in analytics platforms for assisted conversions, and branded search volume as a leading indicator for brand-building content that doesn’t convert immediately.
A few specific methods, in order of how directly they connect to revenue:
- Direct attribution: UTM-tagged links combined with GA4 and your e-commerce platform give the clearest, most direct revenue picture, though platform-reported revenue and analytics-reported revenue will rarely match exactly and need reconciling
- Assisted conversion analysis: reviewing social’s presence anywhere in a multi-touch conversion path, not just as the last click, surfaces contribution that last-click attribution misses entirely
- Incrementality testing: geo-based holdout tests or platform-native lift studies measure what would have happened without the social spend at all, the strongest evidence available when it’s feasible to run
- Branded search as a proxy: consistent growth in branded search volume over 6 to 12 months is a reliable sign that organic content is building genuine brand awareness, even when no single post can be tied to a specific sale
None of these methods works in isolation. The strongest Social Media ROI reporting combines direct tracking where it’s available with these proxy methods where it isn’t, rather than defaulting to vanity metrics because direct tracking feels too hard to set up properly.
What’s a good Social Media ROI benchmark?
There is no single universal Social Media ROI benchmark, since it depends heavily on industry, funnel stage and business objective, though a 3:1 ROAS is commonly cited as a reasonable baseline for profitable paid social in e-commerce, with organic performance best benchmarked against your own historical results first.
A practical way to set benchmarks that actually mean something for your business:
- For paid social, start with the widely cited 3:1 ROAS baseline for e-commerce, then adjust based on your own margins, since a low-margin category needs a higher ROAS to be genuinely profitable than a high-margin one
- For organic social, benchmark against your own prior-period performance first, then against direct competitors using engagement rate and share of voice comparisons
- Be sceptical of any agency or team promising a specific ROI number before genuinely understanding your business model, margins and sales cycle, since a believable benchmark only comes from your own data, not an industry-wide average applied blindly
In Conclusion
Social Media ROI isn’t hard to calculate because the formula is complicated; it’s a straightforward percentage. It’s hard because most businesses only track half of what actually contributes to the answer, the easy-to-export half, while leaving out assisted conversions, earned media value and the slower-building brand impact that often matters more over a full year than any single month’s number.
Get the framework right once, and every future reporting conversation gets easier, not harder, because you’re no longer starting from scratch trying to prove the channel’s worth every quarter.
If you’re trying to build social media reporting that can actually answer the CMO’s question in a board meeting, Flora Fountain works as a Digital marketing agency in Ahmedabad for exactly this kind of measurement work. Drop us a line at hello@florafountain.com and let’s build a framework that ties your social spend to numbers your business actually cares about.
Frequently Asked Questions

Vasim Samadji is a partner at Flora Fountain, where he leads the Business and Marketing Strategy divisions. In a world where everyone is used to sugarcoating, his directness is often considered rude. But that shouldn't be a problem if you like the no-nonsense approach. Because he is a seasoned professional...