

Every month, Chief Marketing Officers and Founders sit through hour-long presentations filled with beautiful graphs.
The slides boast about a 50% increase in impressions, a massive spike in click-through rates, and thousands of new social media followers.
Yet, when the finance director reviews the monthly profit and loss statement, the revenue has barely moved.
If this scenario sounds familiar, you are experiencing the most common friction point in modern digital marketing. A mediocre advertising agency will report on metrics that make it look good.
An elite advertising agency, on the other hand, will report on metrics that make your business profitable.
Privacy updates, AI-driven media buying, and saturated markets mean that basic reporting is no longer sufficient. If you want to accurately measure ad agency performance, you must upgrade your financial vocabulary and demand absolute transparency.
Here is the definitive, boardroom-ready guide on advertising agency KPIs that actually matter.
Table of Contents
- Why Your Current Agency Report is Hiding the Truth
- Phase 1: The Foundational Financial KPIs Every CMO Must Demand
- Phase 2: Advanced Analytics (How Elite Agencies Prove Their Worth)
- KPIs to Measure for Advertising Agency’s Success in India
- The Ultimate CMO Dashboard Template: What to Expect from Your Partner
- Conclusion
- Frequently Asked Questions (FAQs)
Why Your Current Agency Report is Hiding the Truth
Many agencies still operate on a fundamentally flawed premise: they believe their job is to buy cheap traffic.
This leads to a reliance on useless metrics such as
- Impressions
- Reach
- Likes
- Cost Per Click (CPC)
While these numbers are useful for a junior media buyer to monitor daily account health, they are practically useless to a Chief Marketing Officer.
A high Click-Through Rate is completely irrelevant if the conversion rate is zero.
A cheap Cost Per Click is actually a liability if the traffic consists of bots or unqualified leads.
If your agency is spending 45 minutes of your monthly review talking about “10M+ Reach”, they are hiding the truth about your campaign’s financial failure.
To bridge the gap between marketing and finance, you must enforce a strict set of business-first performance indicators.
Phase 1: The Foundational Financial KPIs Every CMO Must Demand
Before you explore advanced machine learning algorithms, you must ensure your baseline unit economics are sound.
An experienced advertising agency ties its daily execution to these two fundamental metrics.
The CAC LTV Ratio
Customer Acquisition Cost (CAC) tells you exactly how much marketing spend is required to acquire one paying customer.
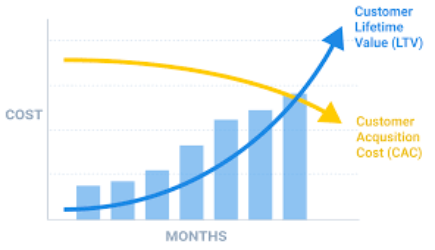
However, CAC in isolation is dangerous. Spending ₹5,000 to acquire a customer is fantastic if they buy a ₹50,000 software package, but it is disastrous if they only buy a ₹2,000 pair of shoes.
This is why the CAC LTV ratio is critical. LTV stands for Customer Lifetime Value, the total gross profit a single customer generates over their relationship with your brand.
- The Target: A healthy, scaling business should aim for a CAC LTV ratio of 1:3. This means for every ₹1 you spend on acquisition, you generate ₹3 in lifetime value.
- The Agency Test: If your agency does not know your average Customer Lifetime Value, they are flying blind. They cannot possibly optimise your ad bids without knowing what a customer is actually worth.
ROAS vs POAS
Return on Ad Spend (ROAS) has been the golden metric for the last decade. If you spend ₹10,000 on ads and generate ₹40,000 in revenue, your ROAS is 4.0.
However, standard ROAS is inherently flawed because it ignores your cost of goods sold, shipping fees, and agency retainers.
In the current landscape, evaluating the ROAS of an advertising agency’s campaign alone in 2026 becomes useless.
What does an expert advertising agency focus on then?
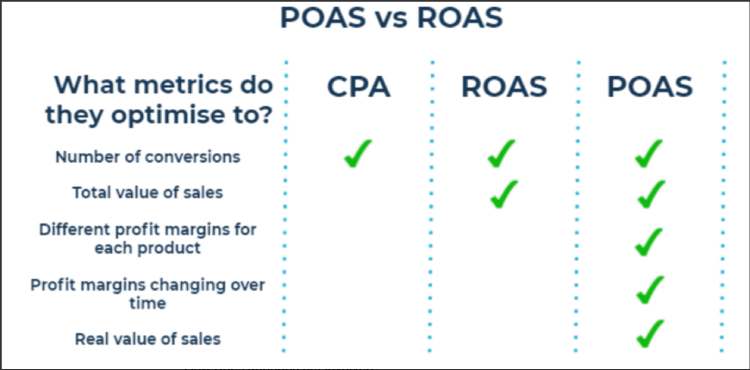
POAS: Profit on Ad Spend.
POAS calculates the actual gross margin generated from the advertising campaign. An agency might celebrate a 3.0 ROAS, but once product costs and operational overheads are deducted, that campaign might actually be losing the company money.
Elite agencies integrate directly with your profit margins to ensure every campaign contributes to bottom-line growth.
Phase 2: Advanced Analytics (How Elite Agencies Prove Their Worth)
Once the foundational unit economics are established, a top-tier agency will deploy advanced data science to eliminate wasted spend.
Attribution Modelling for Ads & Multi-Touch Attribution
For years, the industry relied on “Last-Click Attribution.” This meant the final ad a user clicked before buying received 100% of the credit for the sale. This is incredibly inaccurate.
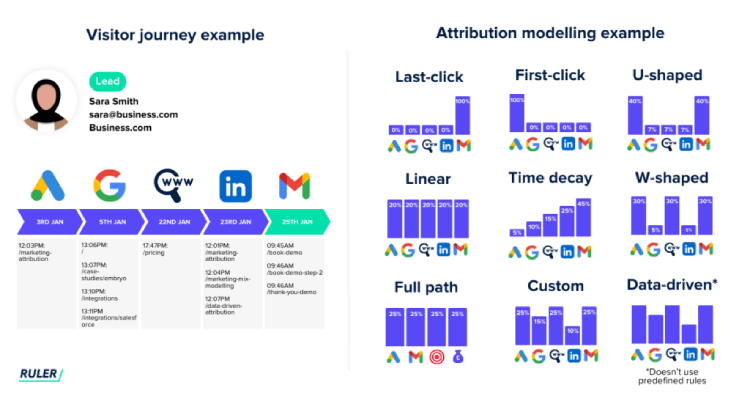
A consumer might:
Watch your YouTube ad on Monday → Read a PR article on Wednesday → click a Facebook retargeting ad on Friday → and finally search your brand name on Google to purchase on Sunday.
If you only look at the last click, you will assume Google Search is your only profitable channel, and you will wrongly turn off your highly effective YouTube ads.
Advanced attribution modelling for ads solves this problem. Elite agencies use multi-touch attribution to map the entire customer journey, assigning fractional credit to every single touchpoint. This ensures you invest your budget into the channels that initiate the journey, not just the ones that close it.
Incrementality Testing
This is perhaps the most sophisticated tool in a modern marketer’s arsenal.
Incrementality testing answers the ultimate business question: “Would this customer have bought from us anyway, even if we had never shown them this ad?”
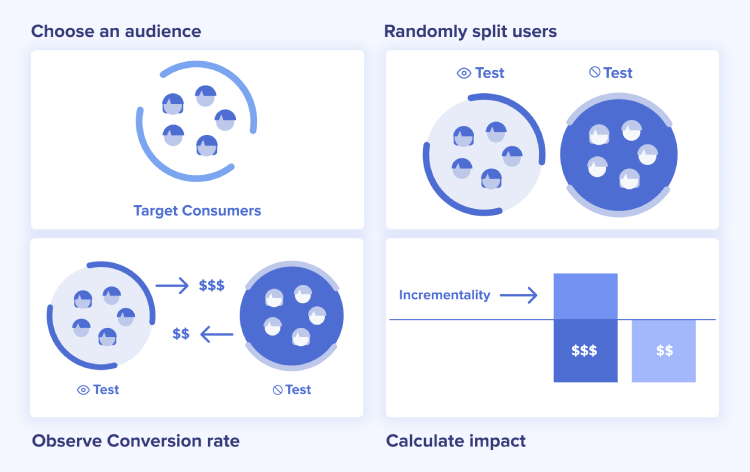
Many retargeting campaigns claim incredible returns by simply showing ads to people who already had items in their shopping cart. Incrementality testing involves running controlled experiments. The agency will split your audience in half.
- Group A sees your ads
- Group B sees a blank space or a charity ad
By comparing the final sales data of the two groups, you can measure the true, incremental revenue generated strictly by the advertising effort.
Media Mix Modelling
While multi-touch attribution focuses on tracking individual users (which is becoming harder due to cookie deprecation), media mix modelling takes a macro view.
This is a statistical analysis that looks at all historical data: your ad spend across television, print, Facebook, and Google, alongside external factors like seasonality and economic trends. It determines exactly how each channel interacts with the others. If you increase your billboard spend by 20%, media mix modelling predicts exactly how much your digital search volume will increase as a result.
KPIs to Measure for Advertising Agency’s Success in India
Executing global strategies requires deep local nuance.
Measuring KPIs for an advertising agency’s success in India comes with unique challenges that need careful consideration.
- Cash on Delivery (COD) Return Rates: In the Indian e-commerce market, a massive percentage of orders are COD.
- A bad agency will report a “Conversion” the moment the order is placed online.
- A great agency will track the “RTO” (Return to Origin) rate and only report on delivered, paid orders.
- A bad agency will report a “Conversion” the moment the order is placed online.
- The WhatsApp Consideration Phase: Indian consumers heavily prefer conversational commerce.
- Your agency must have the technical ability to track a user who clicks a Facebook ad, initiates a WhatsApp chat, and eventually closes the deal over a phone call three days later.
- Your agency must have the technical ability to track a user who clicks a Facebook ad, initiates a WhatsApp chat, and eventually closes the deal over a phone call three days later.
- Tier 2 and Tier 3 Optimisation: Metro cities and regional towns have vastly different purchasing power and conversion delays.
- Your dashboard should segment Customer Acquisition Costs geographically to prevent metro budgets from subsidising inefficient regional campaigns.
The Ultimate CMO Dashboard Template: What to Expect from Your Partner
Do not accept a data dump. You should demand a live, interactive dashboard that separates operational noise from executive signals.
Here is a clear template of what your advertising agency’s KPIs reporting structure should look like.
| Reporting Frequency | Target Audience | Key Metrics to Track | Actionable Purpose |
|---|---|---|---|
| Weekly Sync | Marketing Managers & Agency Account Managers | Cost Per Lead (CPL), Click-Through Rate (CTR), Platform Specific ROAS, and Creative Fatigue Alerts | Tactical shifts: Pausing underperforming ads and scaling winning creatives |
| Monthly Review | Marketing Directors & CMOs | Profit on Ad Spend (POAS), Blended Customer Acquisition Cost (CAC), Total Marketing Originated Revenue | Budget reallocation across different platforms based on profitability |
| Quarterly Strategy | Board of Directors, Founders, CMOs | CAC LTV Ratio, Incrementality Lift, Media Mix Modelling Insights, Market Share Growth | High-level business planning, launching new products, and setting annual budgets |
Conclusion
The days of paying an agency simply to exist and post content are gone. You are hiring a financial partner whose sole responsibility is to multiply your investment.
If your current reporting lacks discussions about incrementality, profit margins, and lifetime value, you are likely leaving vast amounts of money on the table. It is time to elevate the conversation.
Demand transparency. Demand multi-touch attribution. Demand that your partners speak the language of business growth. If you are ready to work with an advertising agency that treats your marketing budget with the same financial rigour as an investment fund, the experts at Flora Fountain are ready to build your custom, ROI-obsessed dashboard today.
Frequently Asked Questions

The founder and partner of Flora Fountain, Shefali leads the Content and Technology divisions. A one-time engineer who started her career writing front-end code, she took a detour sometime during her 9 years in New York, studied journalism and started writing prose, poetry and sometimes jokes. She now has 15...